
Metal 3D-Printed Heat Sinks
Background and Motivation
For ME 103 at UC Berkeley, our team investigated how metal 3D-printed heat-sink geometry affects thermal behavior under natural convection. We asked whether adding surface area within a fixed bounding volume would improve performance, and how that comparison would change when accounting for mass.
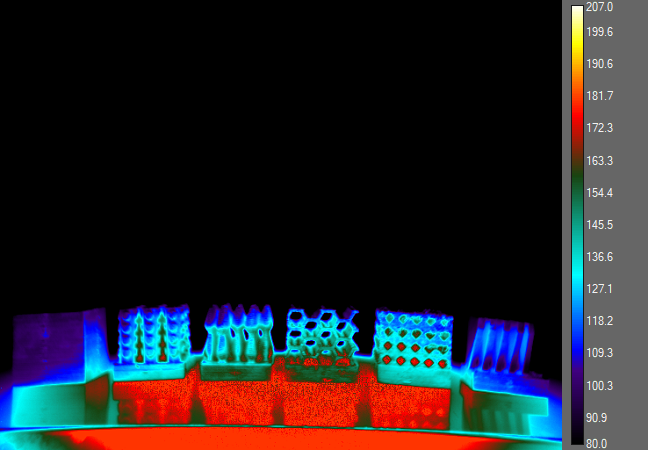
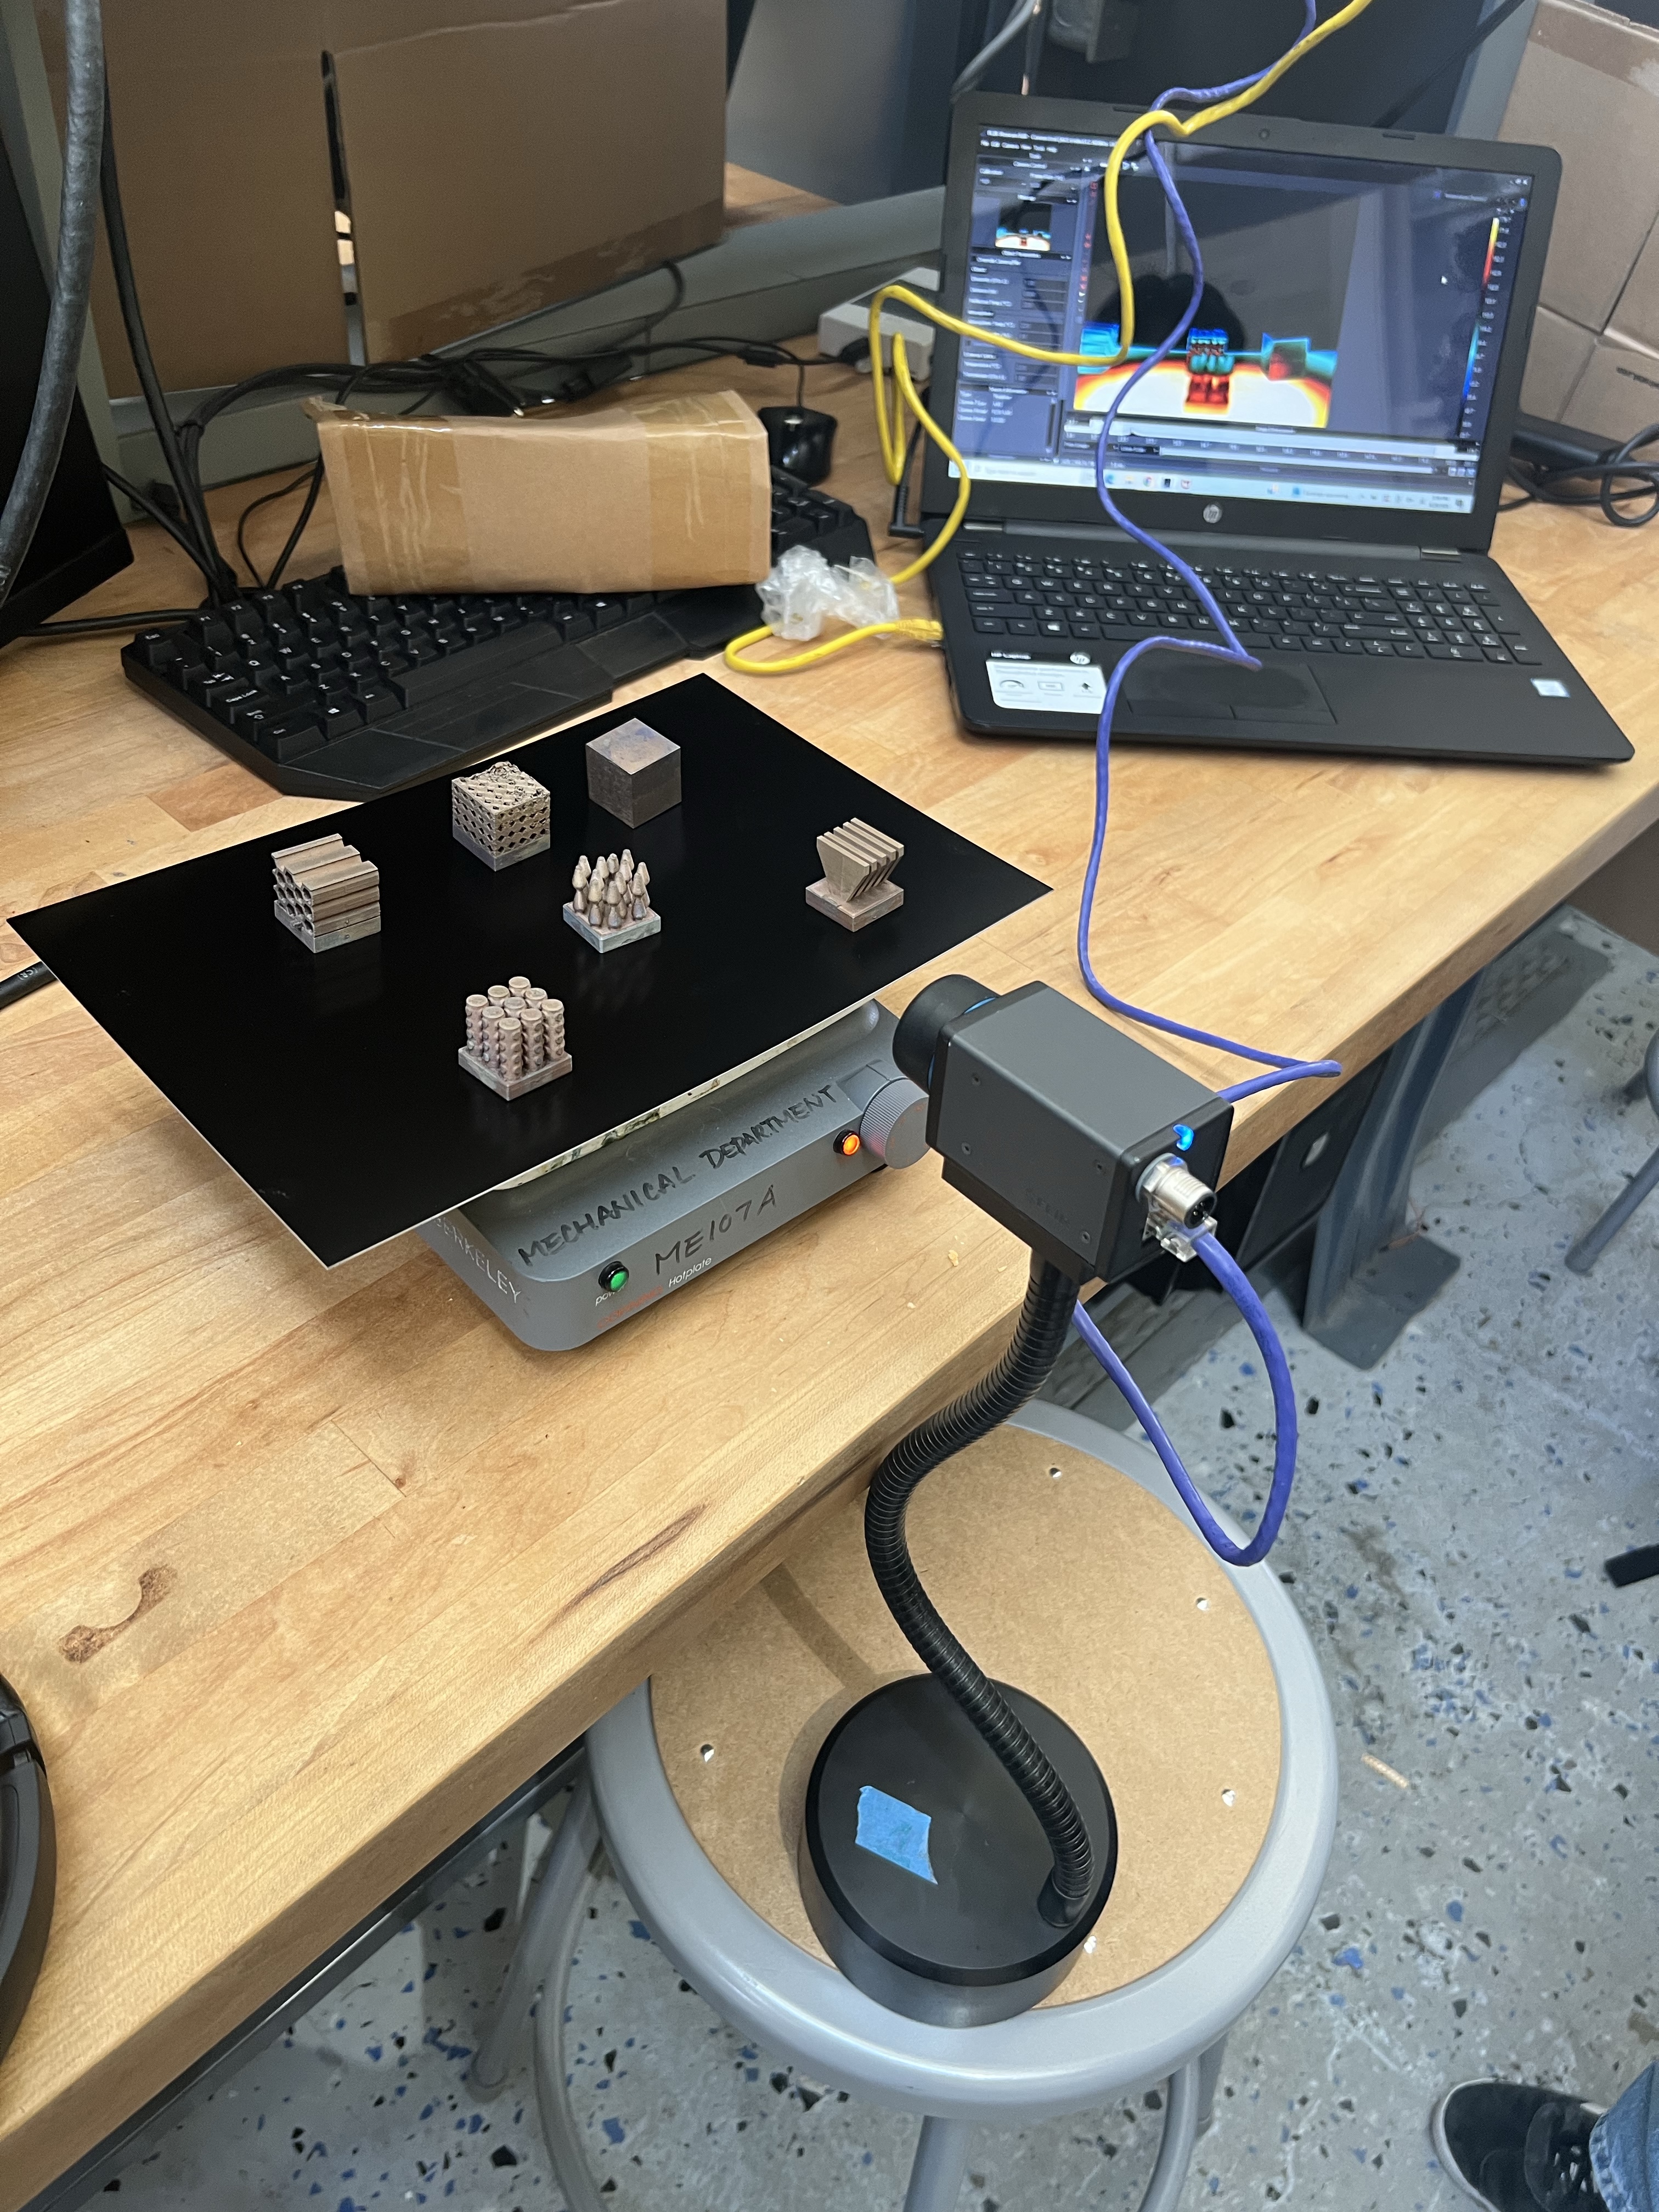
We designed six tested geometries in Onshape and compared temperature distributions after conductive heating on a hot plate. All parts were made from 17-4 stainless steel, shared the same base contact area, and had the same print-layer orientation. A FLIR thermal camera provided 800 frames for temperature and gradient analysis.
Contributors
- Carlos Rendon-Camacho
- Ishaan Gupta
- Emiliano Melendrez
- Eric Lopez
Geometry and Manufacturing
The tested designs were Solid Cube, Octopus, Bowling Pins, Honeycomb, Dorito Chips, and Hex Pipes. They ranged from a solid reference block to open fins and enclosed cellular structures. Each fit within the same bounding box and contacted the hot plate through a 1 in² base.
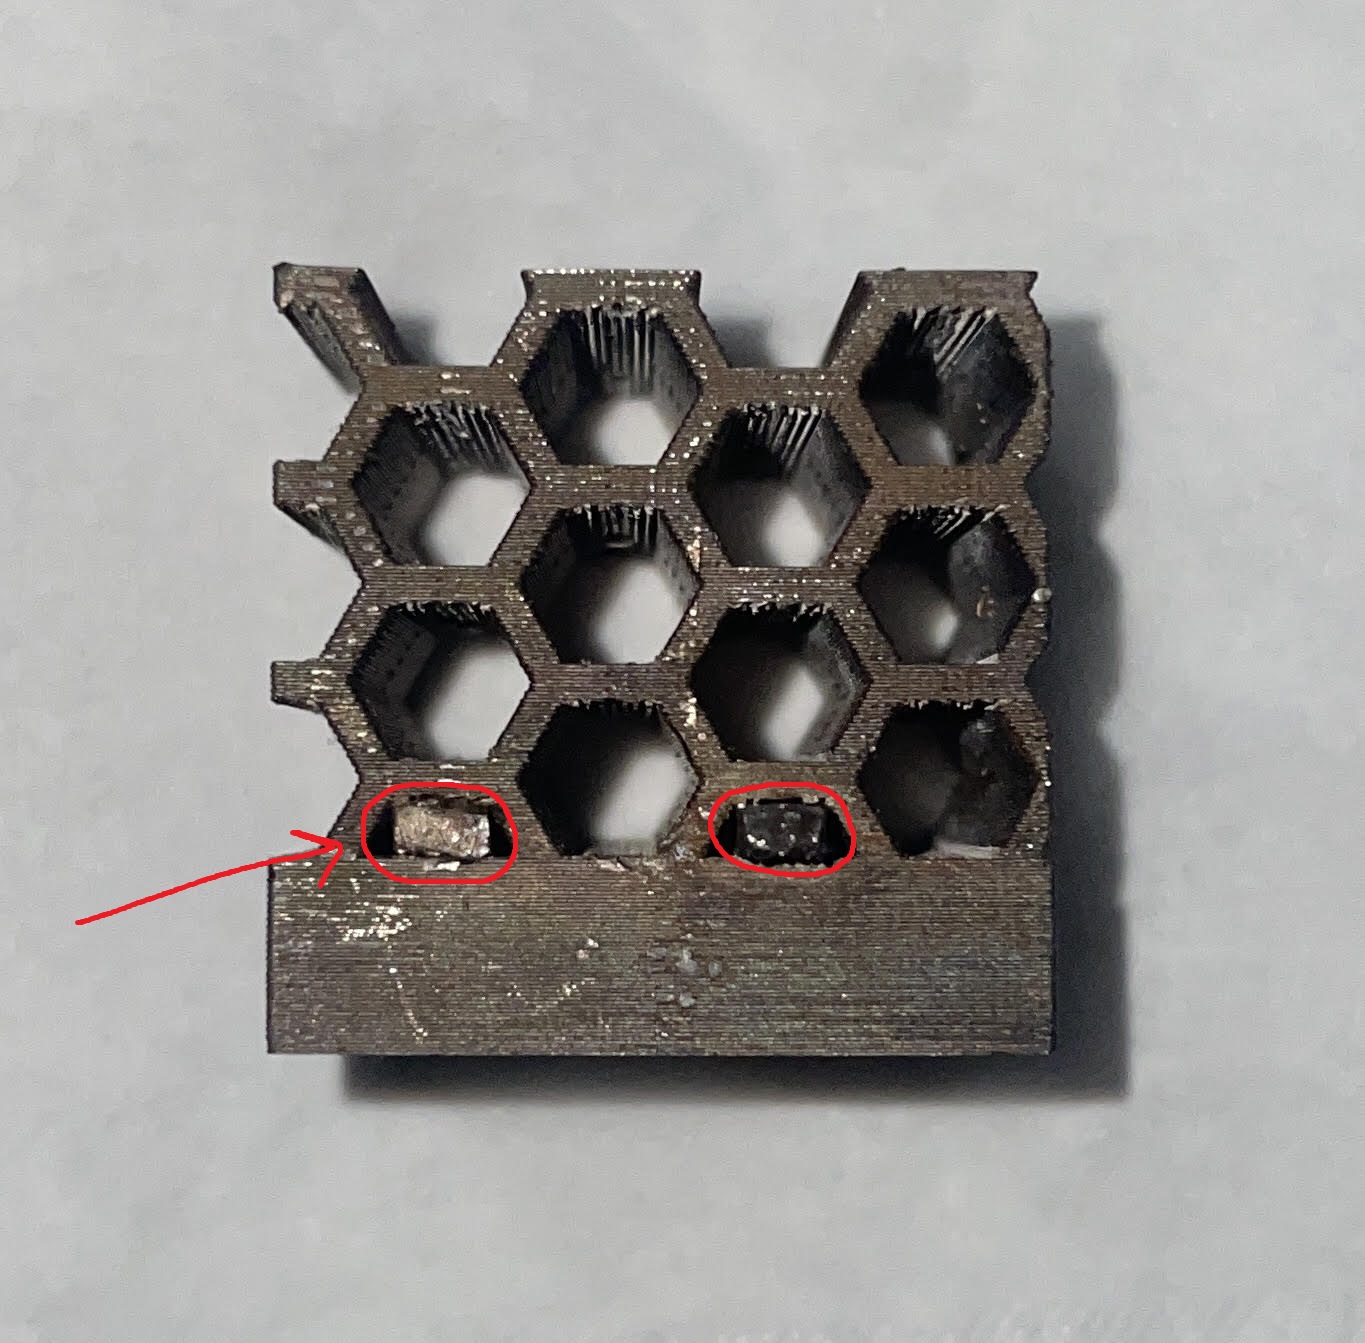
Eight designs were originally planned, but only six survived printing and sintering sufficiently for testing. This made manufacturing quality part of the experiment: remaining support material, surface imperfections, and damaged features could affect both conduction paths and airflow exposure.
Experimental Setup
Camera Calibration
We checked the FLIR camera against an ice-water mixture near 0 °C and boiling water near 100 °C. Temperature data was processed in FLIR Research Studio, using points of interest and outlined regions to extract measurements. The report estimated measurement uncertainty between ±0.21 °C and ±0.50 °C.
These reference checks helped assess the camera response, although the heat-sink measurements later exceeded 100 °C. Surface emissivity, reflections, and the extrapolation beyond the calibration references remained practical limits of the measurement method.
Test Procedure
Each heat sink was placed on the same hot plate at its highest setting and allowed to heat for 20 minutes before recording. All tests took place on the same day under the same ambient conditions, with air treated as quiescent.
We captured 100 frames per geometry. Dorito Chips and Hex Pipes each received another 100 frames after a 90-degree rotation to examine their asymmetric features, giving 800 frames in total.
| Test parameter | Value |
|---|---|
| Material | Metal 3D-printed 17-4 stainless steel |
| Tested geometries | 6 |
| Base contact area | 1 in² per part |
| Heating time before capture | 20 minutes |
| Ambient temperature | 27 °C |
| Reference base temperature | 157 °C, measured without a heat sink |
| Recorded thermal frames | 800 |
The report estimated nominal heat input by distributing the hot plate’s 555 W rating across its 35 in² surface:
\[q''_{\mathrm{nom}}=\frac{555\ \mathrm{W}}{35\ \mathrm{in}^2} =15.86\ \mathrm{W/in}^2\] \[Q_{\mathrm{nom}}=q''_{\mathrm{nom}}A_{\mathrm{contact}} \approx15.9\ \mathrm{W}\]This was an estimate based on uniform heat input, rather than a direct measurement of power entering each part. Contact resistance and losses from the exposed hot plate can change the actual heat flow.
Temperature Maps and Analysis
Steady-State Check
We compared frame-to-frame temperature differences against measurement uncertainty. The standard deviations across the eight image groups ranged from 0.13 °C to 0.23 °C, below the report’s ±0.50 °C uncertainty bound. This supported treating the recorded interval as approximately steady state.
Mean Temperature and Gradient Maps
Averaging the frames reduced measurement noise and made the geometry comparisons easier to interpret. Gradient maps showed where surface temperature changed most sharply; they describe temperature variation rather than directly measuring local heat flux.
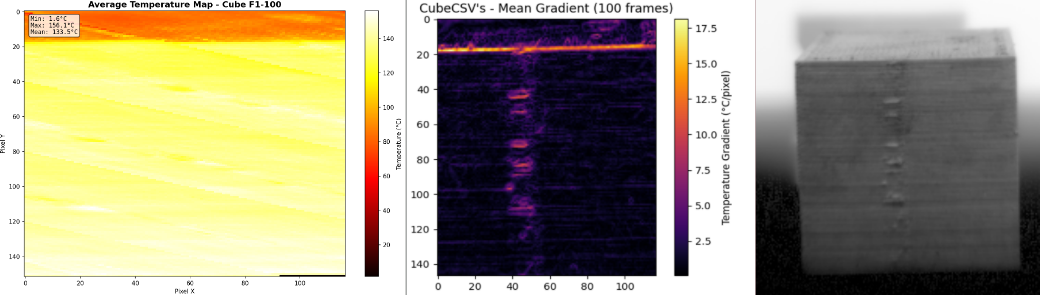
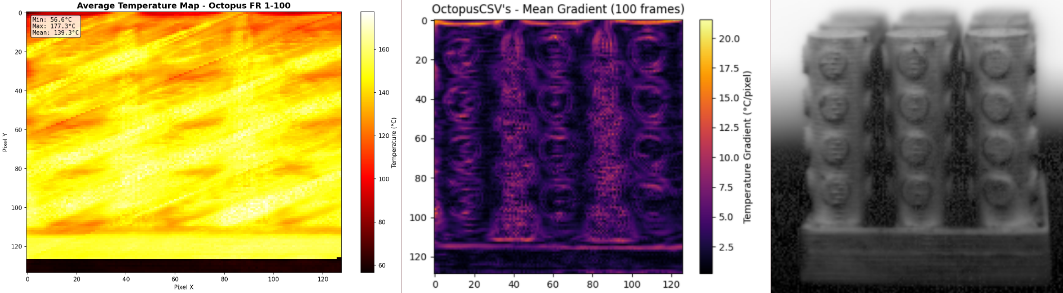
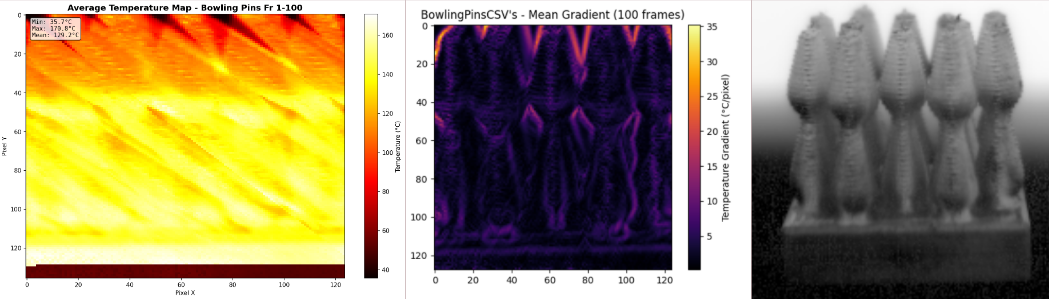
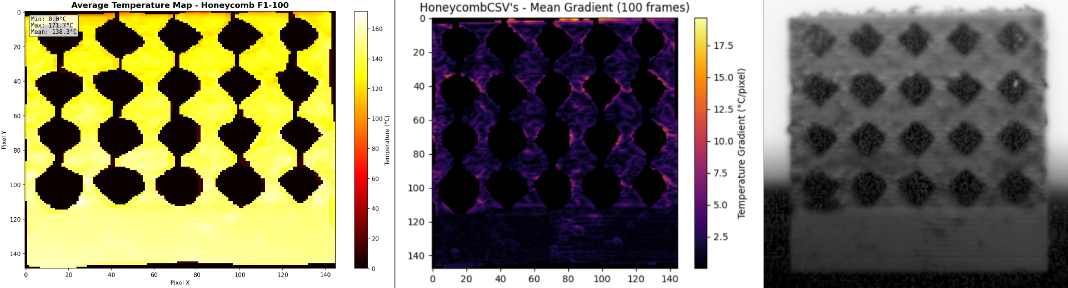
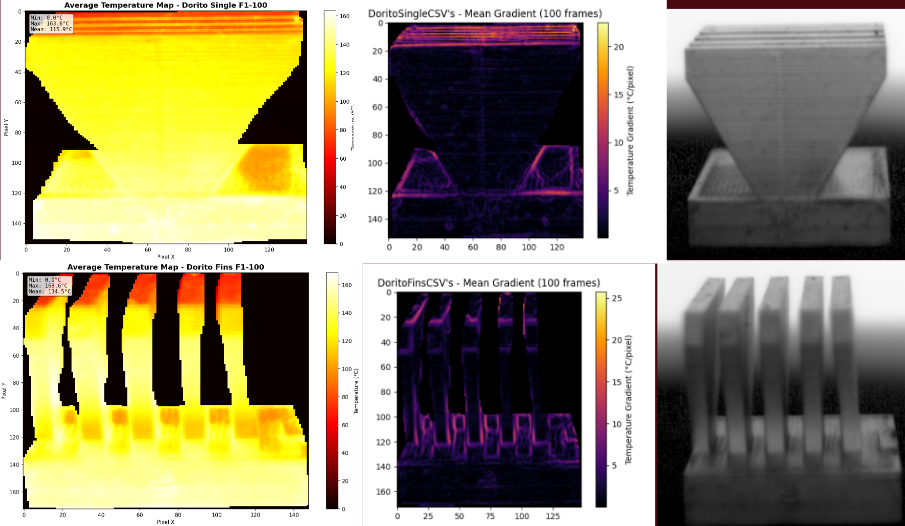
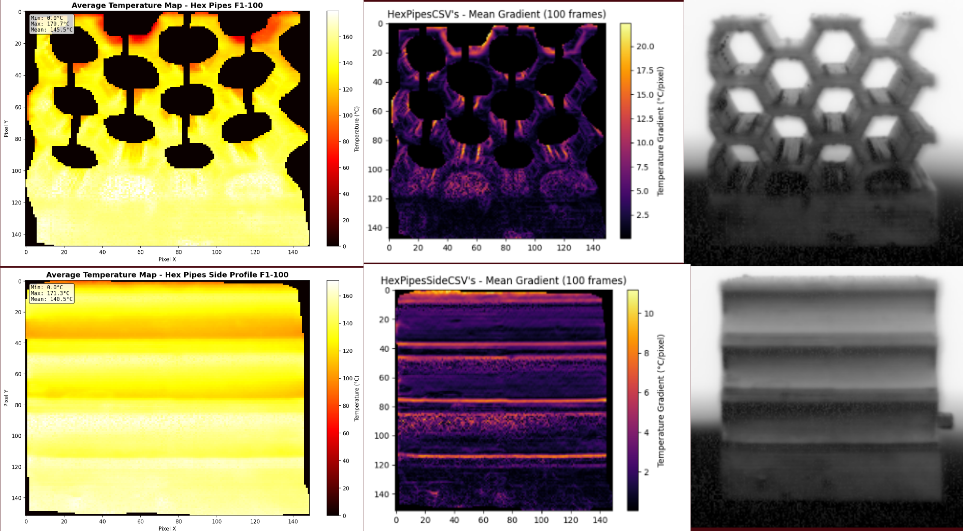
The report identified different winners depending on the temperature metric. The Cube had the lowest reported peak temperature, about 158 °C, while Hex Pipes reached about 180 °C. Dorito Chips had the lowest reported bulk mean temperature, about 128 °C, compared with about 146 °C for Hex Pipes.
Temperature-Ratio Metric and Mass Normalization
The report called the following temperature ratio “fin efficiency”:
\[\eta_T=\frac{T_{\mathrm{tip}}-T_{\mathrm{ambient}}} {T_{\mathrm{base}}-T_{\mathrm{ambient}}},\qquad S_m=\frac{\eta_T}{m}\]This ratio compares how closely a measured fin temperature approaches the reference base temperature. It is a temperature-based comparison metric; conventional fin efficiency instead compares actual heat transfer with the heat transfer of an isothermal fin. Dividing by mass adds a material-use comparison, but does not produce a dimensionless efficiency.
| Geometry | Reported temperature ratio | Reported mass-normalized score |
|---|---|---|
| Solid Cube | 89.39% | 3.19 |
| Octopus | 85.55% | 5.41 |
| Bowling Pins | 72.49% | 8.63 |
| Honeycomb | 77.38% | 6.66 |
| Dorito Chips | 74.88% | 11.75 |
| Hex Pipes | 76.40% | 7.56 |
These values reproduce the report’s results table. Its sample temperature-ratio calculation and mass inputs contain inconsistencies, so the scores should be read as reported comparative results rather than independently recalculated quantities with established units.
The Cube ranked first by the raw temperature ratio, while Dorito Chips ranked first by the reported mass-normalized score. The change in ranking highlighted the tradeoff between conducting heat through more material and exposing surface area to surrounding air.
Surface Area and Performance
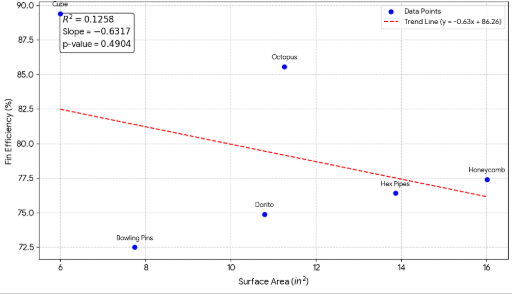
Removing the Cube and Octopus from the regression produced a stronger relationship across the remaining four designs, with a reported p-value of 0.0087 and R² of 0.98.
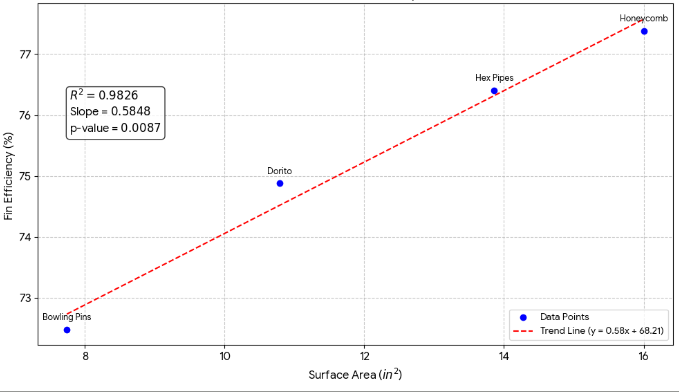
That result applies to the selected subset. It does not establish surface area as a general predictor across all geometries, especially with only four independent designs in the filtered comparison.
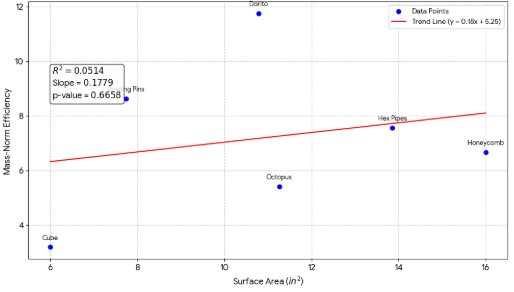
The mass-normalized comparison did not show a clear linear relationship with total surface area. Our interpretation was that open, accessible geometry mattered: added area inside enclosed regions may contribute less under natural convection than surfaces exposed to surrounding air. Dorito Chips performed well in this comparison despite having less total area than Honeycomb or Hex Pipes.
Limitations and Lessons Learned
This study made the interaction between geometry, conduction paths, and natural convection visible. It also showed why the metric must match the engineering decision: peak temperature, temperature uniformity, material usage, and heat-transfer rate describe different aspects of performance.
The results apply to these stainless-steel prints under the tested conditions. Printing defects, residual supports, manually outlined image regions, emissivity effects, and unmeasured contact heat flow limited the comparison. They do not directly predict the behavior of aluminum heat sinks, machined parts, or forced-air cooling.
For a follow-up experiment, I would measure electrical input and contact temperatures for each part, characterize surface emissivity, and compare thermal resistance alongside mass and surface area. That would make the link between geometry and actual heat removal easier to assess.
Acknowledgments
Thanks to the Hesse Shop staff for assistance with metal printing and to the course staff and Dr. Anwar for guidance throughout the project.